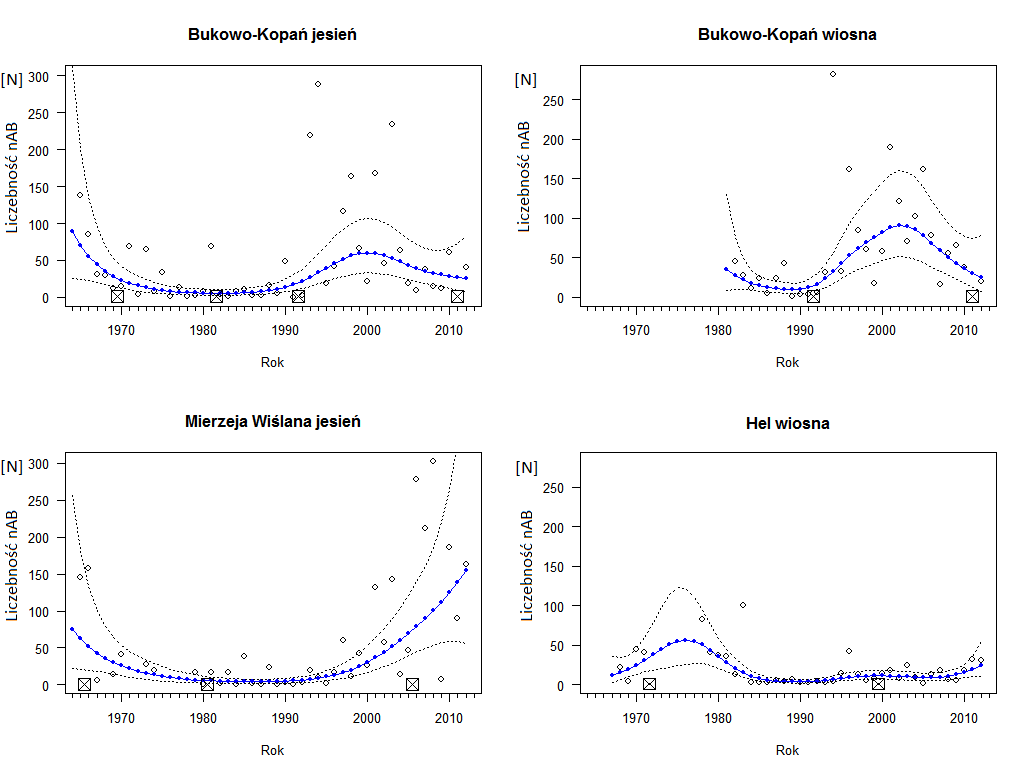
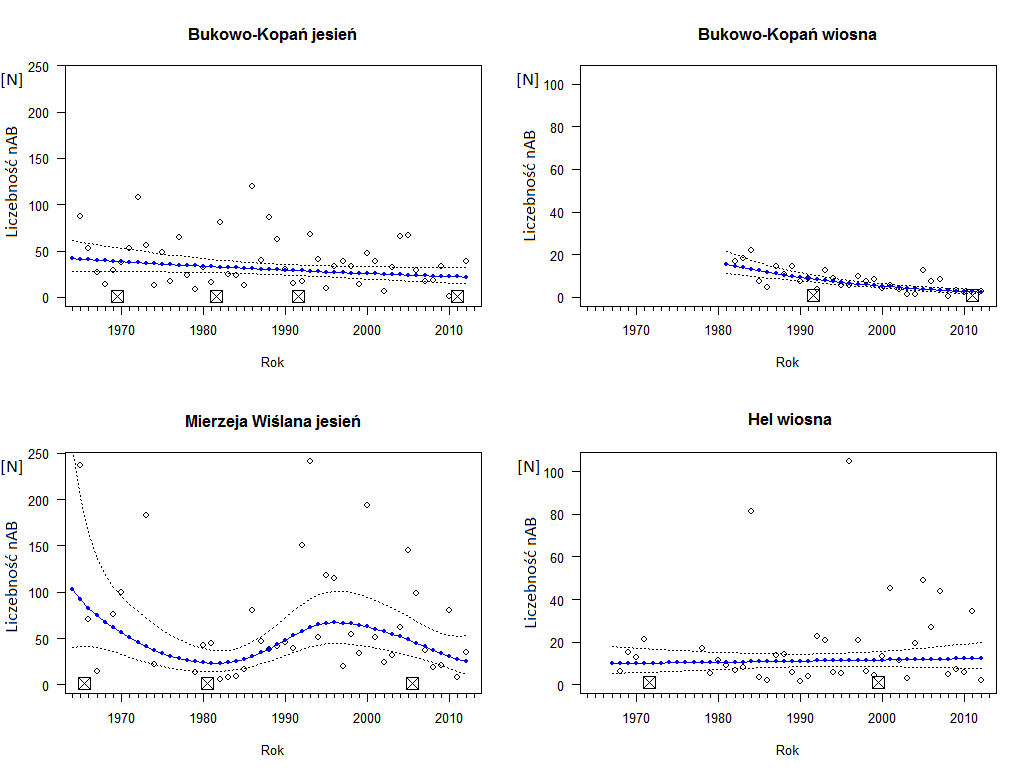
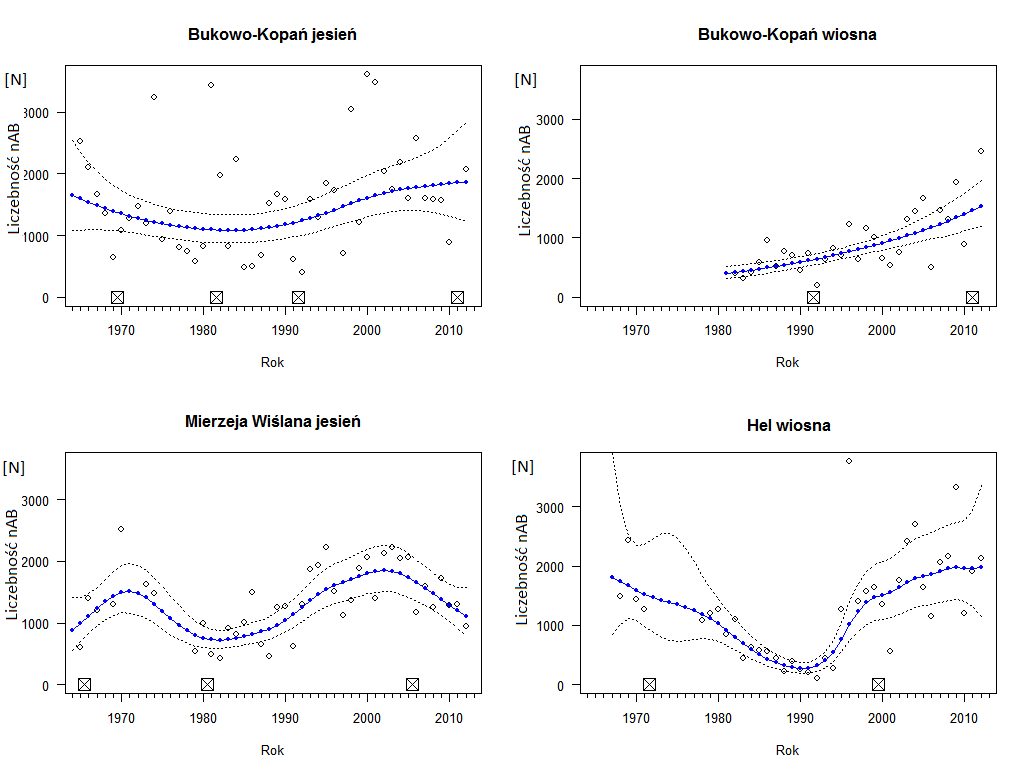
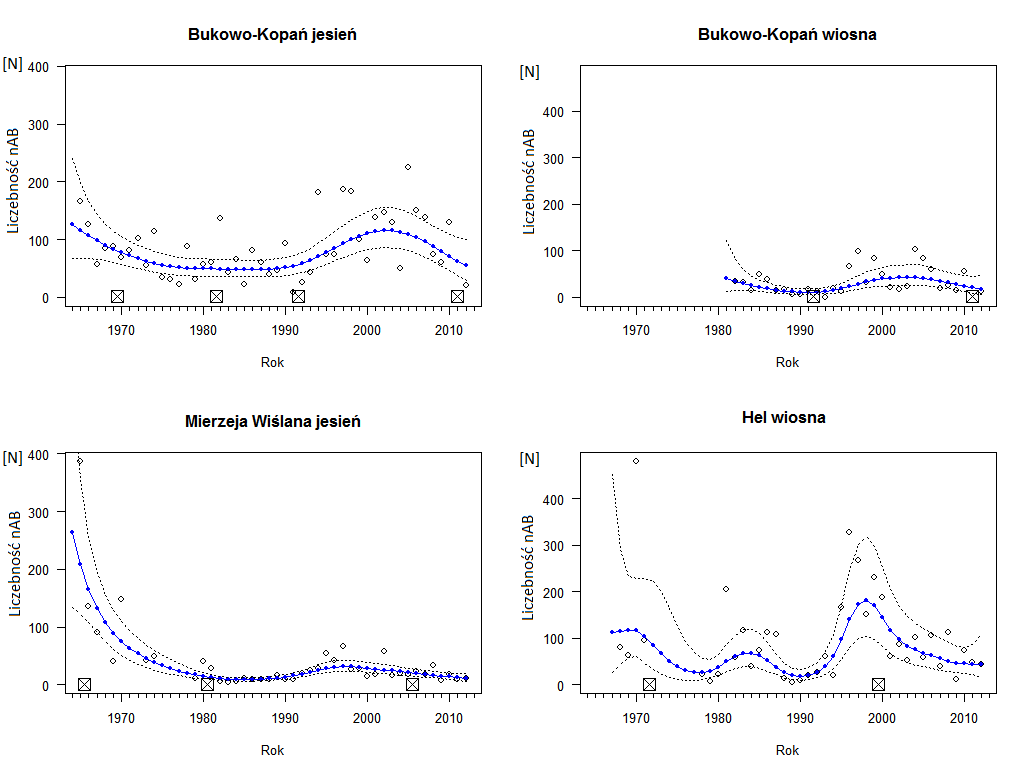
Source:
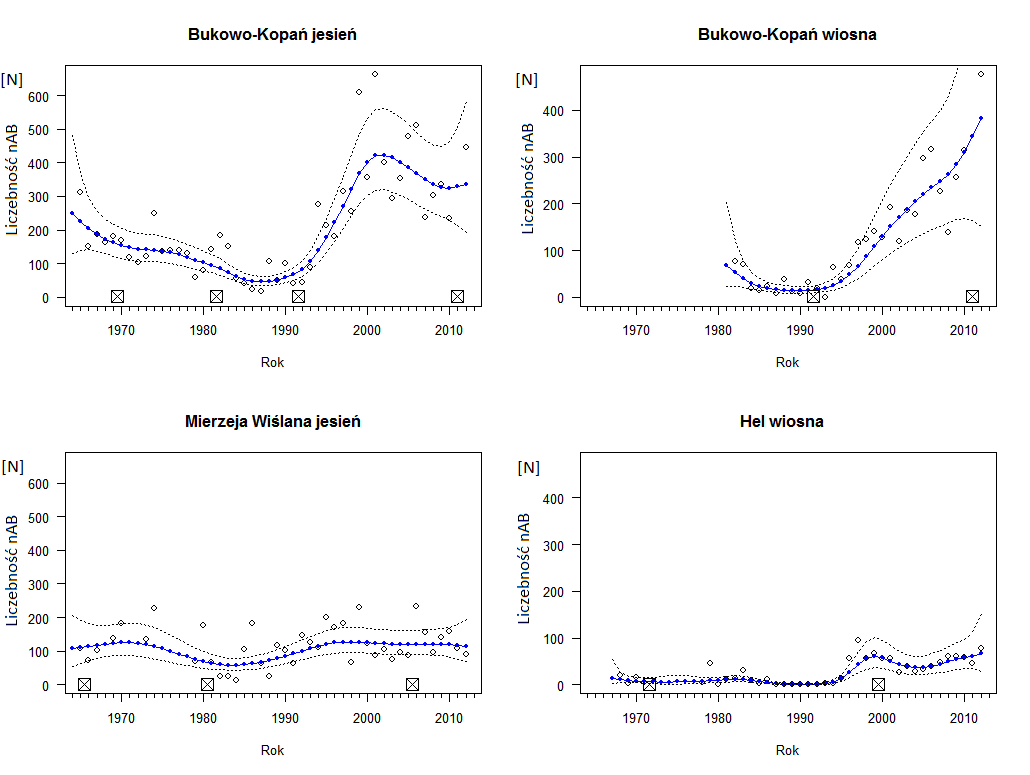
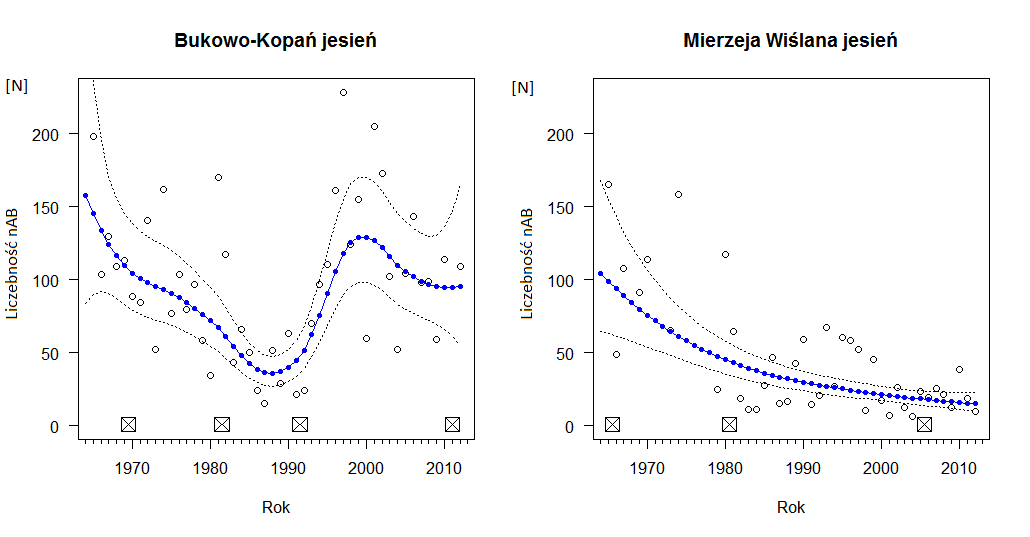
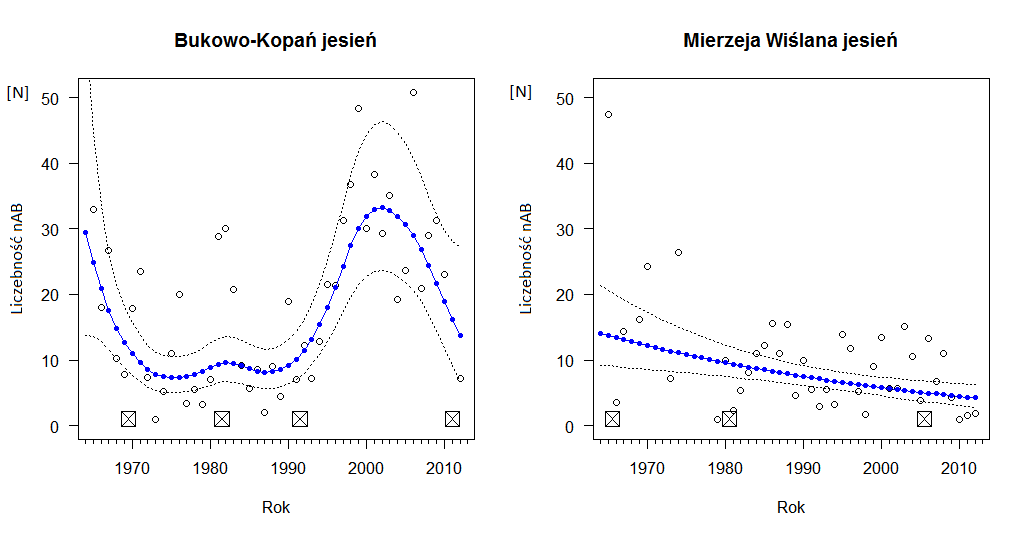
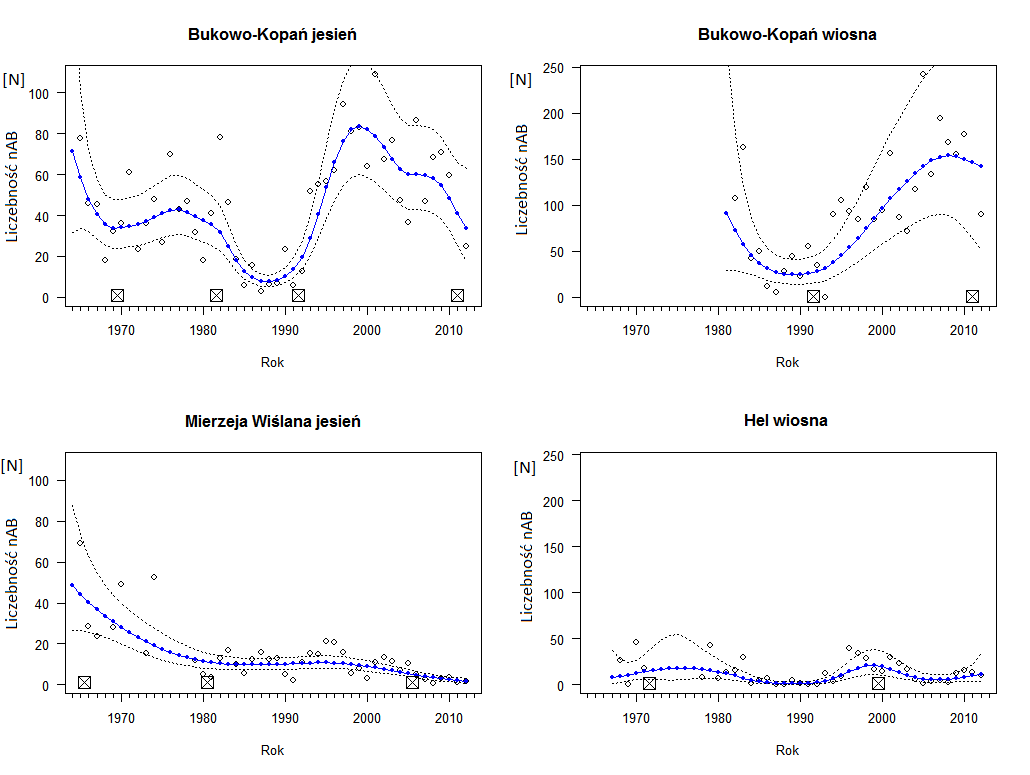
Maciąg T. 2017. Wieloletnie trendy liczebności wybranych gatunków wróblowych w trakcie wiosennej i jesiennej migracji przez polskie wybrzeże Bałtyku. Praca magisterska, Stacja Badania Wędrówek Ptaków, Wydział Biologii Uniwersytetu Gdańskiego [Long-term trends of numbers of some passerine species during spring and autumn migration through the Polish Baltic coast. MSc thesis, Bird Migration Research Station, Faculty of Biology, University of Gdańsk; in Polish]. PDF
Recommended citation:
Maciąg T., Remisiewicz M., Nowakowski J.K., Redlisiak M., Rosińska K., Stępniewski K., Stępniewska K., Szulc J. Website of the Bird Migration Research Station [online]. Gdańsk: University of Gdańsk, 2017 [updated 2017-..- ..], [accessed on …. – write the date of access]. http://www.sbwp.ug.edu.pl/badania/monitoringwyniki/[/vc_column_text][/vc_column][/vc_row][vc_row type=”in_container” scene_position=”center” text_color=”dark” text_align=”left” overlay_strength=”0.3″][vc_column column_padding=”no-extra-padding” column_padding_position=”all” background_color_opacity=”1″ background_hover_color_opacity=”1″ width=”1/2″]
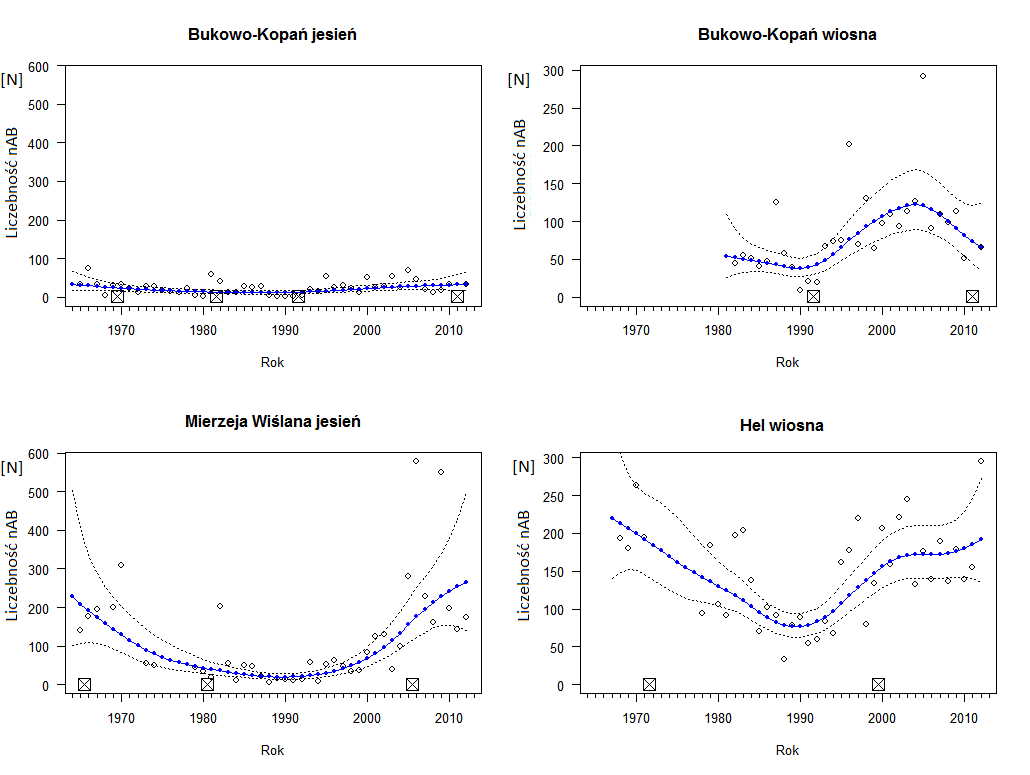
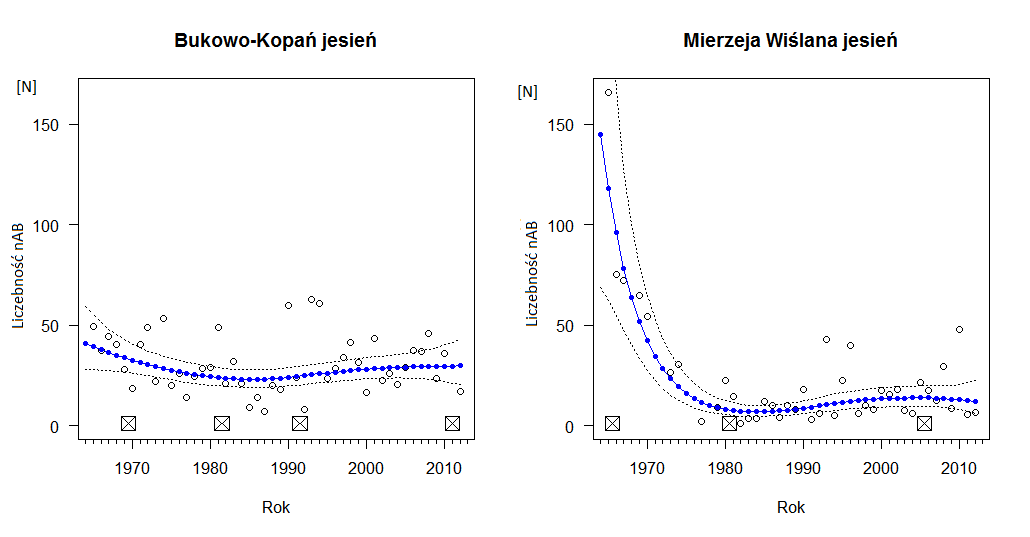
[vc_column_text]Czyż / Siskin / Spinus spinus
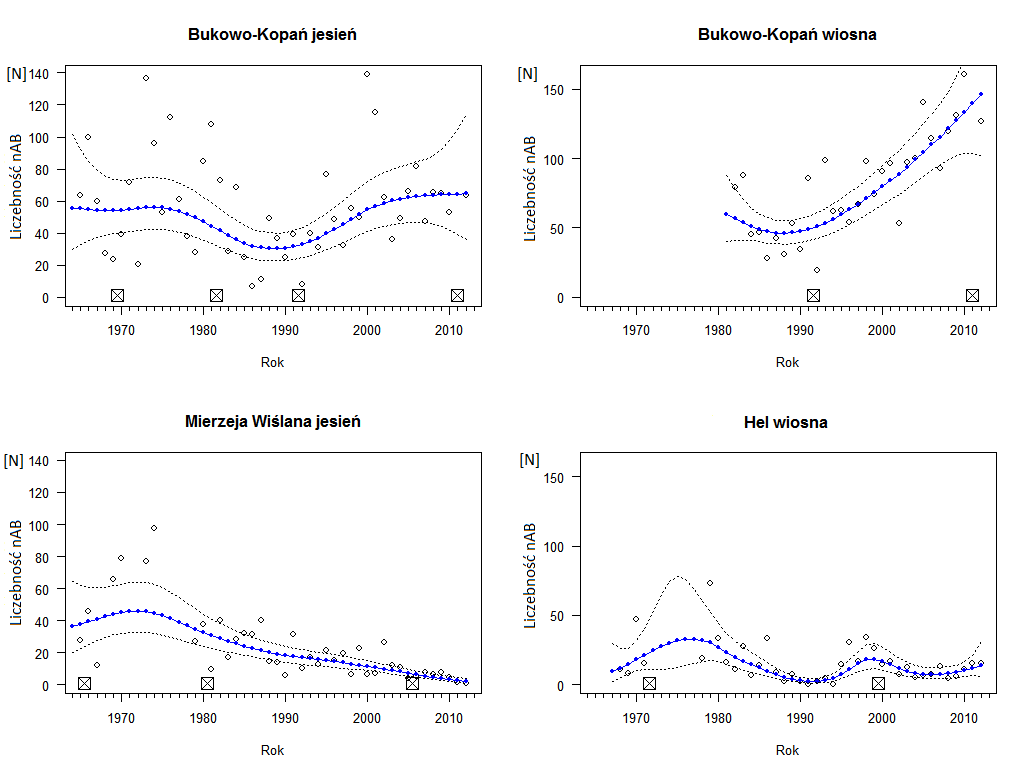
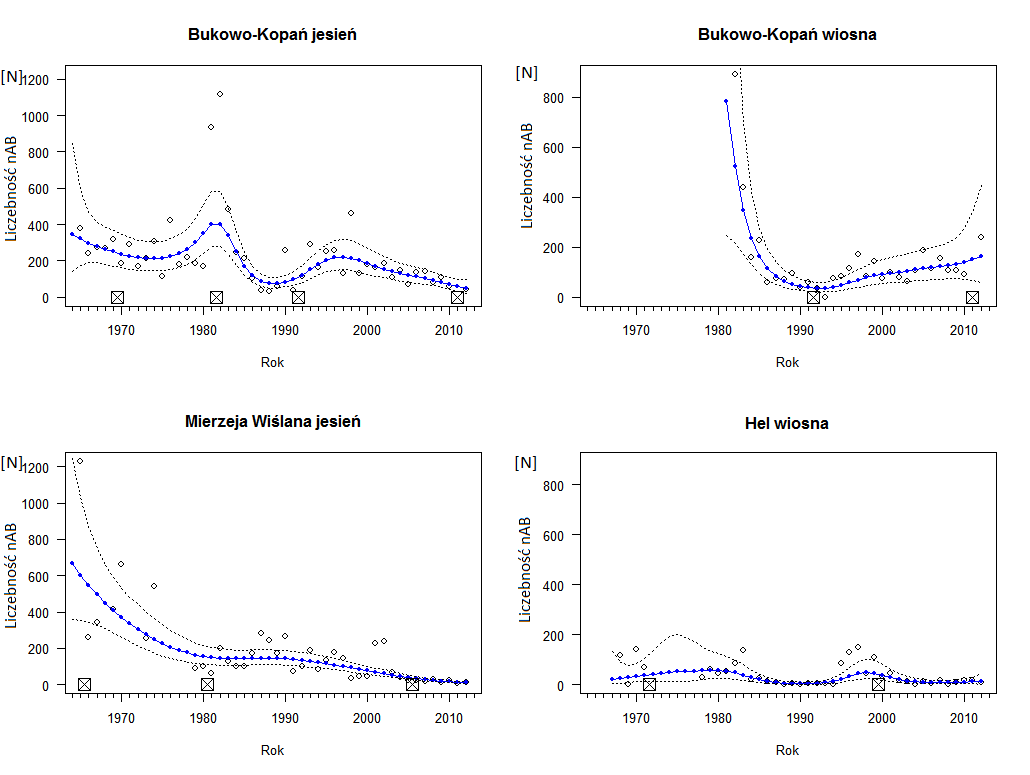
[/vc_column_text][/vc_column][vc_column column_padding=”no-extra-padding” column_padding_position=”all” background_color_opacity=”1″ background_hover_color_opacity=”1″ width=”1/2″][vc_column_text]Pełzacz leśny / Eurasian treecreper / Certhia familiaris[/vc_column_text][/vc_column][/vc_row][vc_row type=”in_container” scene_position=”center” text_color=”dark” text_align=”left” overlay_strength=”0.3″][vc_column column_padding=”no-extra-padding” column_padding_position=”all” background_color_opacity=”1″ background_hover_color_opacity=”1″ width=”1/2″][vc_column_text]Rudzik / Robin / Erithacus rubecula[/vc_column_text][/vc_column][vc_column column_padding=”no-extra-padding” column_padding_position=”all” background_color_opacity=”1″ background_hover_color_opacity=”1″ width=”1/2″][vc_column_text]Muchołówka żałobna / European pied flycatcher / Ficedula hypoleuca[/vc_column_text][/vc_column][/vc_row][vc_row type=”in_container” scene_position=”center” text_color=”dark” text_align=”left” overlay_strength=”0.3″][vc_column column_padding=”no-extra-padding” column_padding_position=”all” background_color_opacity=”1″ background_hover_color_opacity=”1″ width=”1/2″][vc_column_text]Zięba / Chaffinch / Fringilla coelebs[/vc_column_text][/vc_column][vc_column column_padding=”no-extra-padding” column_padding_position=”all” background_color_opacity=”1″ background_hover_color_opacity=”1″ width=”1/2″][vc_column_text]Pierwiosnek / Chiffchaff / Phylloscopus collybita[/vc_column_text][/vc_column][/vc_row][vc_row type=”in_container” scene_position=”center” text_color=”dark” text_align=”left” overlay_strength=”0.3″][vc_column column_padding=”no-extra-padding” column_padding_position=”all” background_color_opacity=”1″ background_hover_color_opacity=”1″ width=”1/2″][vc_column_text]Pleszka / Redstart / Phoenicurus phoenicurus[/vc_column_text][/vc_column][vc_column column_padding=”no-extra-padding” column_padding_position=”all” background_color_opacity=”1″ background_hover_color_opacity=”1″ width=”1/2″][vc_column_text]Pokrzywnica / Dunnock / Prunella modularis[/vc_column_text][/vc_column][/vc_row][vc_row type=”in_container” scene_position=”center” text_color=”dark” text_align=”left” overlay_strength=”0.3″][vc_column column_padding=”no-extra-padding” column_padding_position=”all” background_color_opacity=”1″ background_hover_color_opacity=”1″ width=”1/2″][vc_column_text]Mysikrólik / Goldcrest / Regulus regulus[/vc_column_text][/vc_column][vc_column column_padding=”no-extra-padding” column_padding_position=”all” background_color_opacity=”1″ background_hover_color_opacity=”1″ width=”1/2″][vc_column_text]Kapturka / Blackcap / Sylvia atricapilla[/vc_column_text][/vc_column][/vc_row][vc_row type=”in_container” scene_position=”center” text_color=”dark” text_align=”left” overlay_strength=”0.3″][vc_column column_padding=”no-extra-padding” column_padding_position=”all” background_color_opacity=”1″ background_hover_color_opacity=”1″ width=”1/2″][vc_column_text]Gajówka / Garden warbler / Sylvia borin[/vc_column_text][/vc_column][vc_column column_padding=”no-extra-padding” column_padding_position=”all” background_color_opacity=”1″ background_hover_color_opacity=”1″ width=”1/2″][vc_column_text]Cierniówka / Common whitethroat / Sylvia communis[/vc_column_text][/vc_column][/vc_row][vc_row type=”in_container” scene_position=”center” text_color=”dark” text_align=”left” overlay_strength=”0.3″][vc_column column_padding=”no-extra-padding” column_padding_position=”all” background_color_opacity=”1″ background_hover_color_opacity=”1″ width=”1/2″][vc_column_text]Piegża / Lesser whitethroat / Sylvia curruca[/vc_column_text][/vc_column][vc_column column_padding=”no-extra-padding” column_padding_position=”all” background_color_opacity=”1″ background_hover_color_opacity=”1″ width=”1/2″][vc_column_text]Strzyżyk / Eurasian Wren / Troglodytes troglodytes[/vc_column_text][/vc_column][/vc_row][vc_row type=”in_container” scene_position=”center” text_color=”dark” text_align=”left” overlay_strength=”0.3″][vc_column column_padding=”no-extra-padding” column_padding_position=”all” background_color_opacity=”1″ background_hover_color_opacity=”1″ width=”1/2″][vc_column_text]Muchołówka szara / Spotted flycatcher / Muscicapa striata[/vc_column_text][/vc_column][vc_column column_padding=”no-extra-padding” column_padding_position=”all” background_color_opacity=”1″ background_hover_color_opacity=”1″ width=”1/2″][/vc_column][/vc_row][vc_row type=”in_container” scene_position=”center” text_color=”dark” text_align=”left” overlay_strength=”0.3″][vc_column column_padding=”no-extra-padding” column_padding_position=”all” background_color_opacity=”1″ background_hover_color_opacity=”1″ width=”1/2″][vc_column_text]Piecuszek / Willow warbler / Phylloscopus trochilus[/vc_column_text][/vc_column][vc_column column_padding=”no-extra-padding” column_padding_position=”all” background_color_opacity=”1″ background_hover_color_opacity=”1″ width=”1/2″][/vc_column][/vc_row]


